If Logan Square feels hard to read right now, you are not alone. One headline says prices are up, another shows a different median, and listings can seem to disappear almost as soon as they hit the market. The good news is that the market becomes much clearer once you know which signals matter most and how to interpret them together. Let’s dive in.
What Logan Square’s market says now
Logan Square still looks like a competitive, relatively fast-moving market. In April 2026, Redfin reported a median sale price of $677,248, 35 median days on market, 138 homes sold, and a 103.1% sale-to-list ratio. Realtor.com reported a median sold price of $695,000, 156 homes for sale, active listings down 17.0% year over year, and median days on market of 22.
Zillow adds another lens, showing a typical home value of $535,894, up 7.1% year over year, along with 52 for-sale listings, 37 new listings, a median sale-to-list ratio of 1.015, and 6 median days to pending. These numbers are not identical because each source measures the market differently. The key takeaway is not to choose one figure, but to see the pattern they point to together.
Why the numbers do not match exactly
This is one of the most common points of confusion for buyers and sellers. Redfin leans on rolling MLS and public-record sale data, Realtor.com blends MLS supply with its own market research, and Zillow’s home value figure is an index rather than a direct sold-price median.
That means you should read these reports as separate views of the same market, not as contradictions. When several sources all point to tight inventory, solid pricing, and quick movement, that is usually the stronger story. In Logan Square, that broader story still suggests a market with limited supply and active demand.
Inventory remains the key signal
If you are trying to understand negotiating power, inventory is one of the first numbers to watch. Realtor.com showed active listings down 17.0% year over year, while Zillow reported 52 homes for sale at month-end. Redfin’s rolling data also showed homes selling in 35 days compared with 58 days a year earlier.
That combination matters. Fewer listings and faster sales usually mean buyers have less room to wait, especially when a home is priced well and shows well. In Logan Square, scarcity still appears to be a stronger signal than abundance.
Logan Square is tighter than the broader market
The neighborhood also looks tighter than Chicago overall. Redfin’s May 2026 Chicago market report said active listings were up less than 1% year over year across the city, with 3.1 months of supply. That means Logan Square’s year-over-year listing decline stands out.
For you, that helps explain why the best homes can still attract quick attention. Even if the broader market feels a little more balanced in some areas, Logan Square has its own pace. Neighborhood-level conditions often matter more than citywide averages when you are making a real decision.
Housing type shapes the market here
One reason Logan Square can be tricky to read is that it is not a one-size-fits-all housing market. CMAP estimates 36,194 total housing units, with 91.5% occupied. Only 17.6% of the housing stock is single-family, while 43.7% is in two- to four-unit buildings, 31.0% is in five- to 49-unit buildings, and 7.7% is in 50+ unit buildings.
That mix changes how the neighborhood behaves. A condo, a converted two-flat, a small multifamily building, and a single-family home may all respond differently to the same market conditions. When you hear that “Logan Square is hot” or “Logan Square is cooling,” the real answer usually depends on the product type.
Older housing stock matters too
The neighborhood’s housing is also older than Chicago overall. The median year built is 1944, and 59.5% of units were built before 1940, compared with 39.1% citywide.
For buyers, that can mean more variation in layout, condition, and updates from one property to the next. For sellers, it means preparation and presentation often carry more weight because buyers are comparing details closely. Two homes on similar blocks can perform very differently depending on finishes, maintenance, and floor plan.
Attached homes play a major role
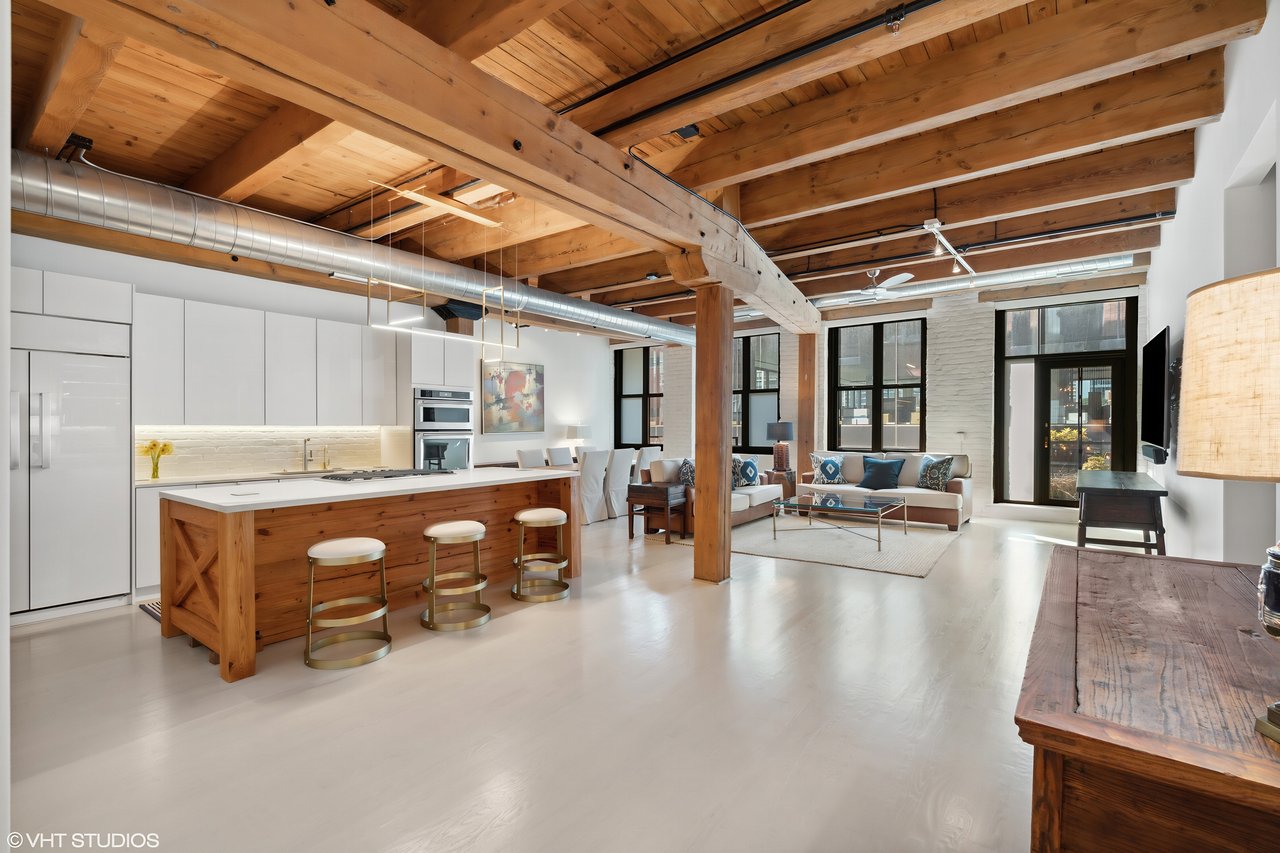
Because so much of Logan Square’s housing is in multiunit buildings, attached homes matter a lot here. Condos, loft-style units, and homes in two- to four-unit buildings make up a large share of what buyers see. That is part of why broad median-price headlines can miss the full picture.
If you are buying or selling an attached home, your true competition is often much narrower than the neighborhood at large. The most useful comparisons may come from similar unit size, building style, condition, and block-to-block location, not just a neighborhood-wide average. This is where careful pricing and strong local context become important.
Demand has more than one driver
CMAP reports that about 38% of occupied units are owner-occupied and 62% are renter-occupied. It also reports a median owner-occupied household income of $159,743, a median renter-occupied household income of $90,171, and median gross rent of $1,814.
Those figures suggest a neighborhood with both owner-occupant demand and a deep rental base. In practical terms, that supports interest across several property types, from primary residences to certain multiunit opportunities. It also helps explain why Logan Square often feels like several overlapping markets instead of one simple one.
Transit access supports interest
Transit is another part of the picture. The CTA says the Blue Line serves the Logan Square station with 24-hour rail service, and CTA’s park guide places Logan Square proper around Milwaukee, Kedzie, Wrightwood, and Logan Boulevard.
That kind of connectivity can support demand for homes with strong access to daily city living. In a neighborhood with a large share of attached housing and multifamily stock, transit access can be especially relevant to how buyers evaluate convenience and long-term appeal. It is not the only factor, but it is part of the market story.
What sellers should watch
For sellers, the clearest message is that preparation still matters. In Redfin’s recent sold examples, a 2-bedroom, 2-bath condo at 1857 N California Ave sold 8% over list after 38 days, a 3-bedroom unit at 2495 N Milwaukee Ave sold 2% over list after 30 days, and a 3-bedroom unit at 2867 W Palmer St sold 15% over list after 29 days.
A 5-bedroom single-family home at 2629 N Troy St sold 5% over list after 58 days. That small sample does not prove every home will outperform list price, but it does show that pricing, condition, and property type all shape the outcome. The market still appears to reward homes that are well-positioned from the start.
Pricing strategy matters more than chasing a headline
It can be tempting to anchor on the highest median you see online. In practice, buyers compare your home against what else they can buy right now, not just against a neighborhood headline. If your home enters the market too high, you may lose momentum even in a competitive area.
That is why sale-to-list ratio and days on market matter so much. In Logan Square, homes are still commonly selling near or above asking, but that does not mean every listing can skip thoughtful pricing. Strong results usually come from matching the price to the specific product, condition, and current buyer pool.
What buyers should watch
For buyers, speed is the biggest takeaway. If median days on market are landing in roughly the 22- to 35-day range, and sale-to-list ratios are near or above 100%, you should expect shorter decision windows on the most attractive homes.
That does not mean every listing is untouchable. If a home sits longer or shows a price reduction, there may be room to negotiate. But the market data does not suggest broad discounts across the board, especially for move-in-ready homes that are well located and priced appropriately.
Look beyond the asking price
In a market like this, asking price is only one signal. You also want to know how quickly similar homes are going pending, whether recent comparable sales closed over list, and how much competition exists within that specific property type.
A polished condo in a well-maintained building may draw a very different response than an older unit that needs updates. The same goes for single-family homes versus small multiunit properties. Reading Logan Square well means understanding the segment you are actually shopping in.
How to read the market more clearly
If you want a simpler framework, focus on a few core indicators together instead of one at a time:
- Inventory: Are listings rising or shrinking?
- Days on market: Are homes moving faster or slower?
- Sale-to-list ratio: Are buyers paying at, below, or above asking?
- Property type: Is the data for condos, single-family homes, or multiunit buildings?
- Condition and presentation: Does the home feel turnkey, dated, or somewhere in between?
When those signals point in the same direction, the market becomes easier to read. In Logan Square right now, they still lean toward a market that rewards realistic pricing, strong presentation, and quick decision-making on the best listings.
If you are trying to make sense of Logan Square from a buyer or seller perspective, the most useful approach is not to chase one headline number. It is to read the neighborhood through the lens of supply, speed, product type, and how your specific property fits the current moment. That kind of nuance is often what separates a stressful experience from a confident one.
If you are thinking about buying or selling in Logan Square and want a more tailored read on your options, Meridian Chicago can help you interpret the market with neighborhood-level strategy and clear guidance.
FAQs
How competitive is the Logan Square real estate market right now?
- Logan Square still appears competitive, with April 2026 data showing median days on market between 22 and 35 depending on the source, and sale-to-list ratios at or above 100%.
Why do Logan Square home price reports show different numbers?
- Different platforms measure different things. Redfin reports closed-sale data, Realtor.com uses its own market summary approach, and Zillow’s typical home value is an index rather than a direct median sold price.
What does low inventory mean for Logan Square home buyers?
- Lower inventory usually means fewer choices and faster decision timelines, especially for move-in-ready homes that are priced well.
What does low inventory mean for Logan Square home sellers?
- Lower inventory can help well-prepared listings stand out, but sellers still need accurate pricing and strong presentation because buyers compare condition and value closely.
Are condos important in the Logan Square housing market?
- Yes. CMAP data shows most housing units are in multiunit buildings, which means condos and other attached homes play a major role in neighborhood market activity.
How should you read days on market in Logan Square?
- Days on market can help show how quickly buyers are acting. In Logan Square, relatively short timelines suggest that desirable listings are still getting absorbed at a healthy pace.
Does property type change how Logan Square homes perform?
- Yes. A condo, single-family home, and small multifamily property can each attract different demand, so neighborhood-wide averages do not tell the whole story for every listing or purchase.
Why does transit access matter in Logan Square real estate?
- CTA’s 24-hour Blue Line service at Logan Square is part of the neighborhood’s connectivity, which can support demand for homes with strong access to city commuting and daily convenience.